The financial results beat market expectations - an average of estimates from 29 analysts had device margins at 8.5% versus the announced 9.8% with similar figures for net income and total sales. Consequently Nokia's share price is slightly up this morning (3% at the time of writing). Nokia lowered its forecasts for Q2 and Q3 2011, suggesting that it faces a tough year ahead, but also announced that it has signed a definitive agreement with Microsoft.
Stephen Elop said:
“In the first quarter, we shifted from defining our strategy to executing our strategy. On this front, I am pleased to report that we signed our definitive agreement with Microsoft and already our product design and engineering work is well under way.
Following a solid first quarter, we expect a more challenging second quarter. However, we are encouraged by our roadmap of mobile phones and Symbian smartphones, which we will ship through the balance of the year. We are fully focused on delivering the needed accountability, speed and results to positively drive our future financial performance.”
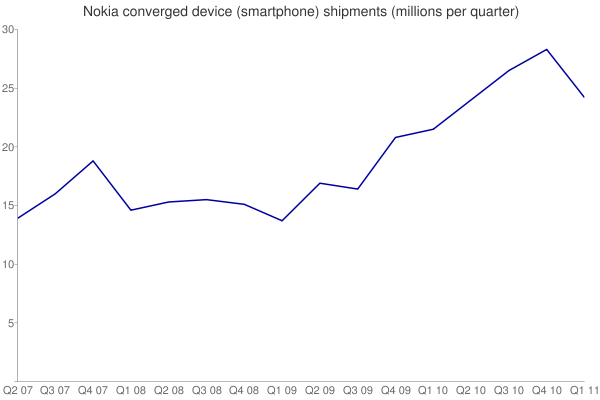
In terms of smartphones, both sales and market share were down, largely in line with expectations, given the competitive market conditions. The smartphone sales show the first major sequential fall since 2008 (although part of this is attributable to the very strong seasonal sales in Q4, 2010), reflecting the challenges that Nokia faces with the competitiveness of Symbian, especially at the higher end of the market.
The smartphone sales figures are unlikely to have been significantly impacted by Nokia's strategy change, which came half way through the quarter. Nokia remains the single biggest smartphone manufacturer by some distance, but will have to work hard to maintain that position through the transition to Windows Phone.
Looking forward, Nokia now expects a tough 2011; in Q2 it is expecting its Devices and Services margin to be between 6% and 9% and devices and services net sales of between 6.1 and 6.6 billion Euros. A similar forecast is expected for Q3 2011. This forecast is lower than previous expectations.
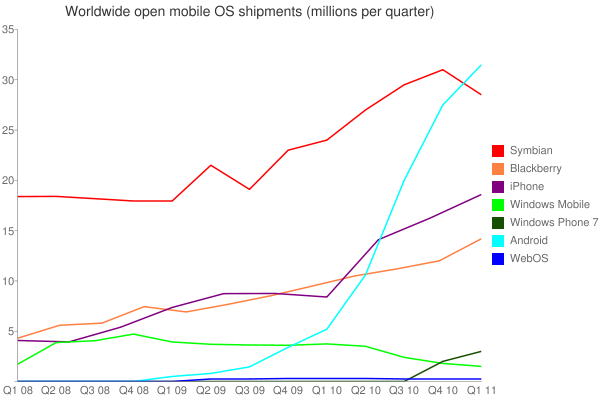
Market context
This chart illustrates the market context in terms of sales of smartphones over the last three years:
Points of interest
- Nokia overall mobile device volumes were 108.5 million units, down 2% year on year and down 12% sequentially. This is set against estimated industry volumes of of 374 million units, up 16% year on year and down 7% sequentially (typical for the Q4 to Q1 periods, due to season sales). Nokia's overall (phones) market share was 29%, down 4% from Q1 2010 and down 2% from Q4 2010.
- Average selling price (across all devices) was €65, up from €62 in Q1 2010 and down from €69 in Q4 2010. Nokia says these changes were mainly due to a higher proportion of converged devices sales (yearly) and price erosion (sequentially)
The average selling price of Nokia's smartphones was €147, down from €155 in Q1 2010 and down from €155 in Q4 2010. This reflects a general price erosion (sequentially) and an increase in the proportion of lower cost smartphones (yearly).
- Smartphone shipments in the quarter were 24.2 million (down from 28.3 million in Q4 2010 and up from 21.5 million in Q1 2010). The year-on-year increase in smartphone sales was 13% and the quarter on quarter decrease was 5%.
- The Ovi Store now has more than 5 million downloads a day (annualised, this would be 1.825 billion per year), up from 4 million/day reported in January 2011).


- Online usage of Ovi Maps was highest in China, India and Russia. Symbian^3 phones are the most popular devices for Ovi Maps usage.
Notes from the earning conference call
- Nokia "saw no sudden change in the consumer perception around Symbian after the February 11th announcement". Stephen Elop noted that "we have deliberately taken steps to improve Symbian, including the recent announcement of the Symbian Anna update and are confident we can engage existing and new Symbian customers during the transition".
- Nokia will not announce specific ship dates [for Windows Phone products] "until we are close to the shipment date".
- Nokia reached the definitive agreement with Microsoft ahead of schedule.
- The lack of dual SIM product has had an impact on sales, and this will continue into Q2. However, the dual SIM C2 will ship at the end of Q2 and further dual SIM devices will follow.
- Nokia have begun pursuing the objectives for examining the next generation of mobile disruptions.
- The Nokia supply chain has been impacted by the tragedy in Japan. Exposure in Q2 has been mitigated, but not altogether alleviated.
- Stephen Elop noted, "our time to market for Windows Phone products will be significantly faster than for any of our other products" and noted that Nokia had been able to show off early work on Windows Phone at a recent [internal] sales team day.
- H2 Symbian device [announcements] will be further down the pricing scale, but are mainly on the new Symbian platform [Symbian^3]. There will also be a range of devices in mobile phones.
See also
Earlier results: Q4 2010, Q3 2010, Q2 2010, Q1 2010, Q4 2009, Q3 2009, Q2 2009, Q1 2009, Q4 2008, Q3 2008, and Q2 2008