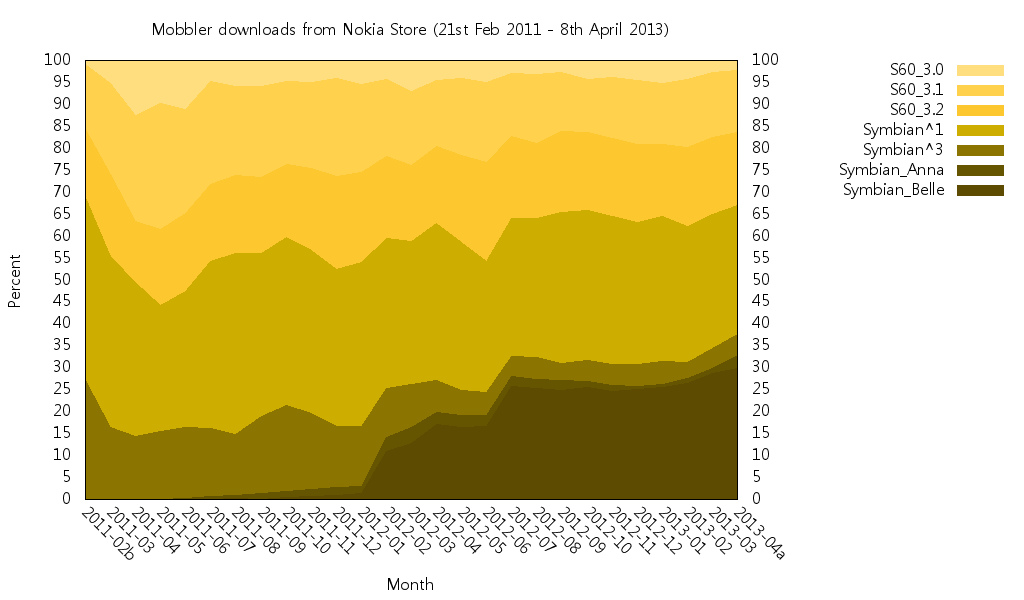
Firstly, here's Hugo's own report, based on the device names of app purchasers:
Mobbler, the open-source Last.fm radio player and scrobbler for Symbian smartphones is five years old today! To commemorate, here's an updated (generated by Ovid) chart showing the share of its 225,098 downloads in the Nokia Store.

With a second year's worth of download data, it's interesting to see S60 3rd Edition is still going strong.
Figures for the last full month (March 2013):
=============================
11 Symbian Belle models: 28.7%
3 Symbian Anna models: 1.1%
5 Symbian^3 models: 4.6%
12 Symbian^1 models: 30.5%
38 S60 3rd ed. models: 36%
-----------------------------
22 S60 3.2 models: 17.5%
12 S60 3.1 models: 14.9%
4 S60 3.0 models: 3.1%
=============================
Let those figures sink in for a moment. April 2013, well over two years since Symbian itself was effectively canned, almost two thirds of downloads from the Nokia Store are still coming from pre-N8 devices, i.e. resistive touchscreens, stylii, d-pad and keypad-driven candybars, etc.
When I look at the installed base of smartphones, grouped by OS, as I do regularly, I've experimented with charts assuming that sales from just the last three (or two) years should count towards the 'active installed base', i.e. those phones and their users still contributing to the platform and ecosystem by, for example, downloading applications. But, given Hugo's figures, maybe I should even be looking at a four year rolling summation at least? The charts for two and three year summations are in the link above, but for completeness, re-doing my usual spreadsheets but taking this four year rolling summation, gives us:

For the purposes of the 'active installed base' chart above, I think we have to assume that three and four year old iPhones and Android devices are just as likely to still be in use (somewhere). In practice, the Android figures should be significantly less since older Android hardware is physically no longer capable of running newer versions of Google applications (etc) that get pushed out via the Android Play Store. Go on, try using a 2009 or 2010 Android phone now - it'll get filled with app updates from Google and the phone will physically stop working. Whereas using a 2009 or 2010 S60 phone is quite practical, at least for its core functions. So, if anything, the chart above is too generous to Android by up to a couple of hundred million. The platform would still be the most numerous, but by a much smaller margin.
We do, however, based on this prospective four year rolling summation, arrive at interesting conclusions further down the chart:
- As of the start of 2013, there are still as many active Symbian users on the planet as there are iPhone users
- There are still ten times as many active Symbian users on the planet as there are Windows Phone users
Of course, I'm not blind to market trends. As always, looking at the installed base doesn't take into account momentum - there are clearly huge numbers of iPhones and Android devices being sold each year and so the trends in the curves above will continue - Windows Phone, Nokia's adopted new 'future proof' platform, will also continue to grow, though active Symbian devices on Planet Earth will continue to be more numerous than active Windows Phones until at least 2015.
The median of Hugo's download numbers seems to be placed somewhere in the S60 5th Edition range, so we're talking 2009-ish - so getting on for four years ago. In fact, if we extrapolate his platform breakdown to the overall Symbian installed base (just over 250 million devices), we might conclude that there are still around 80 million S60 3rd Edition smartphones in active use, many well over three years old and some as old as seven years), plus another 70 million or so active S60 5th Edition devices.
There's a big caveat on all this, of course, in that I'm assuming that Hugo's Mobbler downloads are typical of the whole Symbian application scene. It's entirely possible that his application appealed more to users of older phones, skewing the results. Which is why I'd love to hear from other developers here.
One other very interesting conclusion from Hugo's chart is that it seems that Symbian Anna is almost non-existent now and Symbian^3 showing slight numbers compared to Symbian Belle, showing that Nokia's over-the-air (and Nokia Suite) programme to upgrade all the N8/C7/E7/E6 generation devices to Belle has been a huge success. Many people argue that it's only really geeks that upgrade their device's firmware, but the stats here show that 80% of the total Symbian^3 generation now has Belle installed.
Given how precarious firmware updates were only a few years ago, it seems as if in-place updates really have now matured. Certainly for the N8 or E7 or C7 owner, having now had around four major firmware updates pushed to their devices, for free, with a virtual 100% success rate, their initial investment in their smartphone must seem extremely worthwhile, in terms of sheer value for money.
