The smartphone market continues to grow, and Q1 2011 continued the sustained growth pattern of the last few years. IDC attributes the growth to "a combination of vendors releasing highly anticipated models, widespread availability of older smartphones at lower prices, and sustained end-user demand". Smartphones now make up approximately one quarter of the overall mobile phone market, worldwide - one in every four mobile phones sold is a smartphone.
Top Five Smartphone vendor shipments Q1 2011. Figures from IDC:
| Vendor |
Q1 2011 Shipments |
Q1 2011 Share | Q1 2010 Shipments | Q1 2010 Share |
YoY Change |
| Nokia | 24.2 | 24.3% | 21.5 | 38.8% | 12.6% |
| Apple | 18.7 | 18.7% | 8.7 | 15.7% | 114.4% |
| Research In Motion | 13.9 | 14.0% | 10.6 | 19.1% | 31.1% |
| Samsung | 10.8 | 10.8% | 2.4 | 4.3% | 350.0% |
| HTC | 8.9 | 8.9% | 2.7 | 4.9% | 229.6% |
| Others | 23.2 | 23.2% | 9.5 | 17.1% | 143.7% |
| Total | 99.6 | 100.0% | 55.4 | 100.0% | 79.7% |
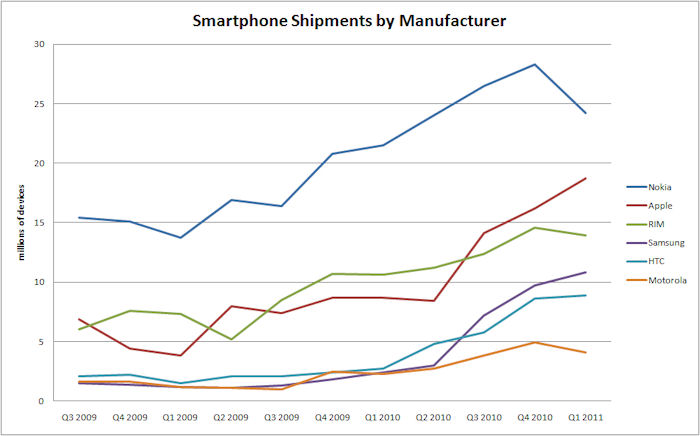
This first chart shows the smartphone shipments by manufacturer, with figures from IDC, over the last eleven quarters. The overall growth of the smartphone market in the last few years is readily apparent. In Q1 2011, Nokia had its first major quarter-on-quarter decrease in three years, reflecting the highly competitive market and lack of competitiveness of Nokia devices, especially at the high end. Apple shipments increased strongly against the usual seasonal flatness. Samsung and HTC also had good Q1s, reflecting the growth of Android devices. RIM and Motorola both had small declines in shipments, most likely reflecting seasonal sales patterns in their core US market.
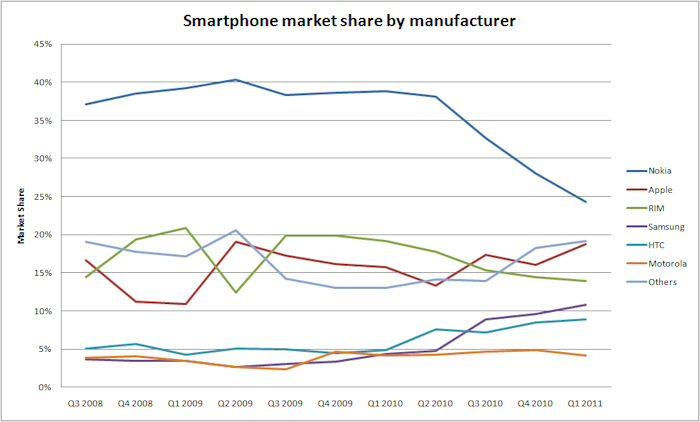
This second and third charts (below) show the smartphone market share by device manufacturer. Nokia's loss of market share over the last twelve months is clearly visible. As Nokia has fallen (-13.8%), Samsung (+6%), and Others [manufacturers not listed separately] (+5%) have increased their market share.
RIM's gradual market share decline (-3.8% in the last 12 months) and Apple's relatively static (outside release demand swings) market share are also apparent. HTC's impressive performance (+1.6%), which has seen it outgrow the market, contrasts with Motorola (+0.2%), which is relatively flat.

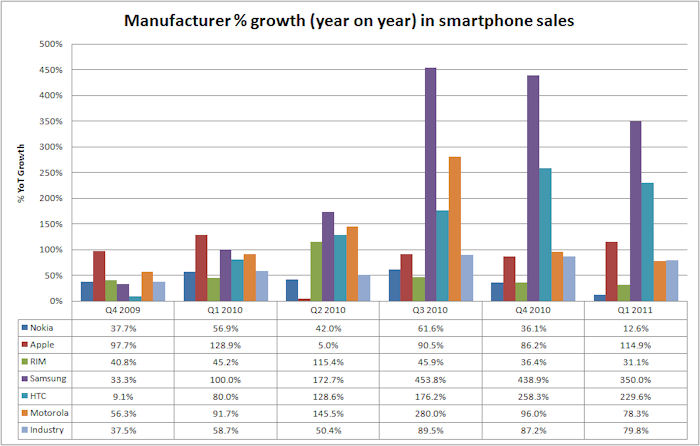
The fourth chart (below) shows the year on year growth rate of smartphone shipments, for each manufacturer, over the last six quarters. This neatly illustrates that while Nokia has continued to grow its smartphone shipments, it has not done so as quickly as other manufacturers. Nokia's year-on-year growth in Q4 2010-Q1 2011 (36.1% and 12.6%) has decreased notably from mid Q2-Q3 2010 (42% and 61.6%), likely a reflection of increasing competition in the mid and low tier.
The rise of Android can been seen in strong shipment growth figures for Samsung, Motorola and HTC. Samsung's smartphone growth has been especially strong in the last three quarters, but some of this is due to poor smartphone sales in 2009 (disproportionate to Samsung's relative industry size).
The fifth chart (below) shows, for each quarter, the proportion of year-on-year smartphone market growth that each company is responsible for (or, in other words, which companies are growing the market). This shows how Samsung, HTC and Other [manufacturers not listed separately] have driven an increasing amount of smartphone market growth in the last 18 months. This is mainly due to rise of Android.

Rafe Blandford, All About Symbian, 6th May 2011