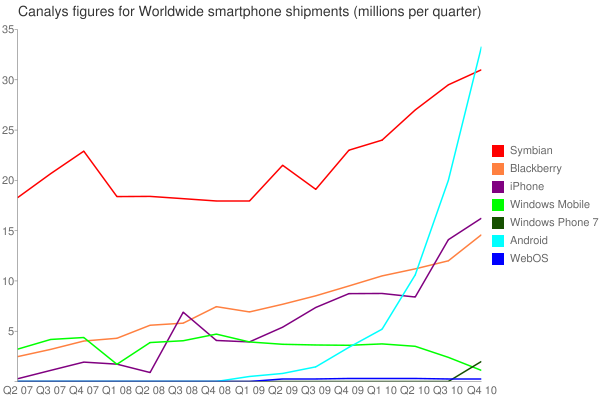
Android taking over Symbian as the leading platform is a noteworthy event. Symbian has been the market share leader since 2000. It places further pressure on Nokia's new CEO, Stephen Elop, to outline how he will improve Nokia's performance in 2011 and 2012. Elop is expected to lay out his strategy for Nokia a week on Friday (February 11th) at an Analyst and Financial event in London.
However, as Canalys point out, Nokia does remain the biggest smartphone manufacturer by some distance (RIM and Apple are second and thid respectively). Nokia is responsible for more than 90% of Symbian shipments, by contrast Android shipments come from a far greater number of companies.
Canalys notes that Android benefited from strong performance by a number of vendors, most notably LG, Samsung, Acer and HTC. Between them, HTC and Samsung accounted for 45% (15 million) of Android shipments. Canalys' figure for Nokia (31.0 million) in the table below includes both Nokia Symbian devices and Symbian-based phone shipments in Japan (Sharp and Fujitsu). Similarly, the Android figure (33.3 million) includes OMS and Tapas shipments (both of which are third party branches of the Android platform).
Worldwide smartphone market: Market shares Q4 2010, Q4 2009 |
|||||
| OS vendor | Q4 2010 shipments (millions) |
% share | QQ4 2009 shipments (millions) |
% share | Growth Q4 10 from Q4 09 |
| Total | 101.2 | 100% | 53.7 | 100% | 88.6% |
| 33.3 | 32.9% | 4.7 | 8.7% | 615.1% | |
| Nokia | 31.0 | 30.6% | 23.9 | 44.4% | 30% |
| Apple | 16.2 | 16% | 8.7 | 16.3% | 85.9% |
| RIM | 14.6 | 14.4% | 10.7 | 20.0% | 36.0% |
| Microsoft | 3.1 | 3.1% | 3.9 | 7.2% | -20.3% |
| Others | 3.0 | 2.9% | 1.8 | 3.4% | 64.8% |
| Source: Canalys estimates | |||||
The figures show declines in market share percentages, from Q4 2009 to Q4 2010, for every platform except Android. Nokia (Symbian) lost 13.8% market share, RIM 5.6%, Apple 0.3%, and Microsoft 4.1%. Proportionally (percentage fall as a percentage of previous share) these numbers are Nokia down 33%, RIM down 28%, Apple down 2% and Microsoft down 56%. However, crucially, due to the overall growth in the smartphone market, all platforms, aside from Microsoft, showed growth in shipments from Q4 2009 to Q4 2010. Some caution should used when assessing these numbers as they are a year on year comparison and can hide underlying longer terms trends (e.g. Nokia's Q4 2009 figures were good compared to rest of 2009).
Here's an updated chart on smartphone market share, with the Q4 figures based on Canalys' figures:

Estimates and definitions
Canalys' figures do mark an important point in the smartphone platform wars, but will not be without controversy. Other market research, analyst and device companies produce similar estimates, sometimes with notably different numbers.
For example, Strategy Analytics published a breakdown of smartphone shipments in 2010, which shows total market volumes for Q4 2010 as 94.1 million (2010 total of 292 million). They did not include a breakdown for Android, but calculated market share for Nokia, Apple and RIM in Q4 2010 at 30.1%, 17.4% and 15.5% respectively. Similarly, in their Q4 results release, Nokia estimated "converged mobile device industry volumes" as 90.5 million units.
In both cases, the discrepancies between the various numbers will be due to both differing estimates and differing definitions. Android platform shipments are difficult to estimate due to the fragmented and multi-manufacturer nature of the platform. One commonly used metric is activations per day, a figure Google regularly releases. In late December, this figure reached 300,000 (equivalent to 27 million per quarter, suggesting an estimate of 25 million or so for Q4 2010). However, a proportion of Android devices are never activated with Google services and therefore are not included in Google's activation numbers.
Definitions can also cause a problem - should sales of devices like the Barnes and Noble's Nook or Samsung's Galaxy Tab be included in smartphone shipment numbers? This can also apply at the low end of the smartphone market where some estimates exclude devices that others might consider smartphones.
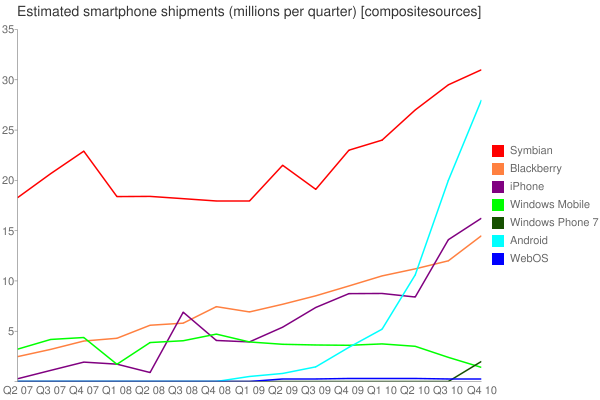
Here's a chart for smartphone shipments, over the last 3.5 years, with figures estimated from composite sources, including device manufacturer results, IDC, Canalys, Strategy Analytics, ABI research and Gartner. As you can see, with a wider range of sources, the Symbian/Android crossover point hasn't quite been reached yet - but, given the trends, is probably inevitable in the next quarter.

